{nadir} 
{nadir}
nadir (noun): nā-dir
the lowest point.
{nadir} implements the super learner algorithm[^1]. To quote the
Guide to SuperLearner[^2] (a previous implementation):
SuperLearner is an algorithm that uses cross-validation to estimate the performance of multiple machine learning models, or the same model with different settings. It then creates an optimal weighted average of those models, aka an “ensemble”, using the test data performance. This approach has been proven to be asymptotically as accurate as the best possible prediction algorithm that is tested.
Fitting with the minimum loss based estimation
literature,[^3],[^4] {nadir} is an implementation of the
super learner algorithm with improved support for flexible formula based
syntax and which is fond of functional programming techniques such as
closures, currying, and function factories.
{nadir} is available on CRAN – You can install it from CRAN using:
install.packages("nadir", dependencies = TRUE)
The development version of {nadir} may be installed from GitHub via
running:
devtools::install_github("ctesta01/nadir", dependencies = TRUE)
It is highly suggested to use dependencies = TRUE so that users
install all of the suggested packages from the packages’s DESCRIPTION
file – after all, the point of super learning is so that you can
leverage all of these great flexible statistical learning softwares that
already exist.
If you are in a rush for some reason, you can install nadir without
the dependencies = TRUE option, but you’d be limited to whatever
learners you already have installed the dependencies for plus a couple
others like lnr_mean, lnr_lm, lnr_glm that are not that
interesting.
{nadir} and why reimplement super learner again?In previous implementations
({SuperLearner},
{sl3},
{mlr3superlearner}),
support for flexible formula-based syntax has been limited, instead
opting for specifying learners as models on an $X$ matrix and $Y$
outcome vector. Many popular R packages such as lme4 and mgcv (for
random effects and generalized additive models) use formulas extensively
to specify models using syntax like (age | strata) to specify random
effects on age by strata, or s(age, income) to specify a smoothing
term on age and income simultaneously.
At present, it is difficult to use these kinds of features in
{SuperLearner}, {sl3} and {mlr3superlearner}.
For example, it is easy to imagine the super learner algorithm being appealing to modelers fond of random effects based models because they may want to hedge on the exact nature of the random effects models, not sure if random intercepts are enough or if random slopes should be included, etc., and similar other modeling decisions in other frameworks.
Therefore, the {nadir} package takes as its charges to:
First, let’s start with the simplest possible use case of
nadir::super_learner(), which is where the user would like to feed in
data, a specification for some regression formula(s), specify a library
of learners, and get back a prediction function that is suitable for
plugging into downstream analyses, like in Targeted Learning or for
pure-prediction applications.
Here is a demo of an extremely simple application of using
nadir::super_learner:
library(nadir)

# we'll use a few basic learners
learners <- list(
  glm = lnr_glm,
  rf = lnr_rf,
  glmnet = lnr_glmnet
)
# more learners are available, see ?learners

sl_model <- super_learner(
  data = mtcars,
  formula = mpg ~ cyl + hp + disp,
  learners = learners
)
## Warning: package 'future' was built under R version 4.5.2
# the output from super_learner is a prediction function:
# here we are producing predictions based on a weighted combination of the
# trained learners.
predict(sl_model, mtcars) |> head()
##         Mazda RX4     Mazda RX4 Wag        Datsun 710    Hornet 4 Drive
##          20.41648          20.41648          24.20135          19.85172
## Hornet Sportabout           Valiant
##          16.89780          19.59764
Continuing with our mtcars example, suppose the user would really like
to use random effects or similar types of fancy formula language
features. One easy way to do so with nadir::super_learner is using the
following syntax:
learners <- list(
  glm = lnr_glm,
  rf = lnr_rf,
  glmnet = lnr_glmnet,
  lmer = lnr_lmer,
  gam = lnr_gam
)

formulas <- c(
  .default = mpg ~ cyl + hp + disp, # our first three learners use same formula
  lmer = mpg ~ (1 | cyl) + hp + disp, # both lme4::lmer and mgcv::gam have
  gam = mpg ~ s(hp) + cyl + disp # specialized formula syntax
)

# fit a super_learner
sl_model <- super_learner(
  data = mtcars,
  formulas = formulas,
  learners = learners
)

predict(sl_model, mtcars) |> head()
##         Mazda RX4     Mazda RX4 Wag        Datsun 710    Hornet 4 Drive
##          20.53980          20.53980          24.43141          19.74459
## Hornet Sportabout           Valiant
##          16.82782          19.64837
nadir::super_learner()?To put the learners and the super learner algorithm on a level playing field, it’s important that learners and super learner both be evaluated on held-out validation/test data that the algorithms have not seen before.
Using the output from nadir::super_learner(), we can call
compare_learners() to see the mean-squared-error (MSE) on the held-out
data, also called CV-MSE, for each of the candidate learners specified.
# construct our super learner and call compare_learners on it
sl_model <- super_learner(
  data = mtcars,
  formulas = formulas,
  learners = learners
)

compare_learners(sl_model)
## Inferring the loss metric for learner comparison based on the outcome type:

## outcome_type=continuous -> using mean squared error

## # A tibble: 1 × 5
##     glm    rf glmnet  lmer   gam
##   <dbl> <dbl>  <dbl> <dbl> <dbl>
## 1  10.8  7.25   10.9  9.44  10.9
Plotting code
pacman::p_load("dplyr", "ggplot2", "tidyr", "magrittr")

truth <- sl_model$holdout_predictions$mpg

holdout_var <- sl_model$holdout_predictions |>
  dplyr::group_by(.sl_fold) |>
  dplyr::summarize(across(everything(), ~ mean((. - mpg)^2))) |>
  dplyr::summarize(across(everything(), var)) |>
  select(-mpg, -.sl_fold) |>
  t() |>
  as.data.frame() |>
  tibble::rownames_to_column("learner") |>
  dplyr::rename(var = V1) |>
  dplyr::mutate(sd = sqrt(var))


jitters <- sl_model$holdout_predictions |>
  dplyr::mutate(dplyr::across(-.sl_fold, ~ (. - mpg)^2)) |>
  dplyr::select(-mpg) %>%
  tidyr::pivot_longer(cols = 2:ncol(.), names_to = "learner", values_to = "squared_error") |>
  dplyr::group_by(learner, .sl_fold) |>
  dplyr::summarize(mse = mean(squared_error)) |>
  ungroup() |>
  rename(fold = .sl_fold)
## `summarise()` has grouped output by 'learner'. You can override using the
## `.groups` argument.
learner_comparison_df <- sl_model |>
  compare_learners() |>
  t() |>
  as.data.frame() |>
  tibble::rownames_to_column(var = "learner") |>
  dplyr::mutate(learner = factor(learner)) |>
  dplyr::rename(mse = V1) |>
  dplyr::left_join(holdout_var) |>
  dplyr::mutate(
    upper_ci = mse + sd,
    lower_ci = mse - sd
  ) |>
  dplyr::mutate(learner = forcats::fct_reorder(learner, mse))
## Inferring the loss metric for learner comparison based on the outcome type:
## outcome_type=continuous -> using mean squared error
## Joining with `by = join_by(learner)`
jitters$learner <- factor(jitters$learner, levels = levels(learner_comparison_df$learner))

learner_comparison_df |>
  ggplot2::ggplot(ggplot2::aes(y = learner, x = mse, fill = learner)) +
  ggplot2::geom_col(alpha = 0.5) +
  ggplot2::geom_jitter(data = jitters, mapping = ggplot2::aes(x = mse), height = .15, shape = "o") +
  ggplot2::geom_pointrange(
    mapping = ggplot2::aes(xmax = upper_ci, xmin = lower_ci),
    alpha = 0.5
  ) +
  ggplot2::theme_bw() +
  ggplot2::ggtitle("Comparison of Candidate Learners") +
  ggplot2::labs(caption = "Error bars show ±1 standard deviation across the CV estimated MSE for each learner\n
Each open circle represents the hold-out MSE of one fold of the data") +
  ggplot2::theme(plot.caption.position = "plot")


Now how should we go about getting the CV-MSE from a super learned
model? We will use the cv_super_learner() function that performs
another layer of cross-validation in order to assess the specified super
learner on folds of held-out data.
If you’d like to read more about how the internals of
cv_super_learner() work, please refer to the article Currying,
Closures, and Function
Factories
article
cv_results <- cv_super_learner(
  data = mtcars,
  formulas = formulas,
  learners = learners
)

cv_results
## Cross-validated Super Learner (nadir_cv_sl)
##   outcome:      mpg (continuous)
##   outer folds:  5   inner CV folds: 5
##   cross-validated loss on held-out data: 7.3379
## Methods: $cv_trained_learners, $cv_loss, $crossfit
Plotting code
cv_jitters <- cv_results$cv_trained_learners |>
  dplyr::select(split, predictions, mpg) |>
  tidyr::unnest(cols = c("predictions", "mpg")) |>
  dplyr::group_by(split) |>
  dplyr::summarize(mse = mean((mpg - predictions)^2)) |>
  dplyr::bind_cols(learner = "super_learner")


cv_var <- cv_results$cv_trained_learners |>
  dplyr::select(split, predictions, mpg) |>
  tidyr::unnest(cols = c(predictions, mpg)) |>
  dplyr::mutate(squared_error = (mpg - predictions)^2) |>
  dplyr::group_by(split) |>
  dplyr::summarize(mse = mean(squared_error)) |>
  dplyr::summarize(
    var = var(mse),
    mse = mean(mse),
    sd = sqrt(var),
    upper_ci = mse + sd,
    lower_ci = mse - sd
  ) |>
  dplyr::bind_cols(learner = "super_learner")

new_jitters <- bind_rows(jitters, cv_jitters)

learner_comparison_df |>
  bind_rows(cv_var) |>
  dplyr::mutate(learner = forcats::fct_reorder(learner, mse)) |>
  ggplot2::ggplot(ggplot2::aes(y = learner, x = mse, fill = learner)) +
  ggplot2::geom_col(alpha = 0.5) +
  ggplot2::geom_jitter(data = new_jitters, mapping = ggplot2::aes(x = mse), height = .15, shape = "o") +
  ggplot2::geom_pointrange(
    mapping = ggplot2::aes(xmax = upper_ci, xmin = lower_ci),
    alpha = 0.5
  ) +
  ggplot2::theme_bw() +
  ggplot2::scale_fill_brewer(palette = "Set2") +
  ggplot2::ggtitle("Comparison of Candidate Learners against Super Learner") +
  ggplot2::labs(caption = "Error bars show ±1 standard deviation across the CV estimated MSE for each learner\n
Each open circle represents the hold-out MSE of one fold of the data") +
  ggplot2::theme(plot.caption.position = "plot")


Model hyperparameters are easy to handle in {nadir}. Two easy
solutions are available to users:
nadir::super_learner() has an extra_learner_args parameter that
can be passed a list of extra arguments for each learner.... syntax, it’s easy
to build new learners from the learners already provided by {nadir}.Here’s some examples showing each approach.
extra_learner_args:# when using extra_learner_args, it's totally okay to use the
# same learner multiple times as long as their hyperparameters differ.
sl_model <- nadir::super_learner(
data = mtcars,
formula = mpg ~ .,
learners = c(
glmnet0 = lnr_glmnet,
glmnet1 = lnr_glmnet,
glmnet2 = lnr_glmnet,
rf0 = lnr_rf,
rf1 = lnr_rf,
rf2 = lnr_rf
),
extra_learner_args = list(
glmnet0 = list(lambda = 0.01),
glmnet1 = list(lambda = 0.1),
glmnet2 = list(lambda = 1),
rf0 = list(ntree = 3),
rf1 = list(ntree = 10),
rf2 = list(ntree = 30)
)
)
compare_learners(sl_model)
## Inferring the loss metric for learner comparison based on the outcome type:

## outcome_type=continuous -> using mean squared error

## # A tibble: 1 × 6
##   glmnet0 glmnet1 glmnet2   rf0   rf1   rf2
##     <dbl>   <dbl>   <dbl> <dbl> <dbl> <dbl>
## 1    10.7    8.91    8.21  8.86  6.29  6.72
When does it make more sense to build new learners with the
hyperparameters built into them rather than using the
extra_learner_args parameter?
One instance when building new learners may make sense is when the user
would like to produce a large number of hyperparameterized learners
programmatically, for example over a grid of hyperparameter values.
Below we show such an example for a 1-d grid of hyperparameters with
glmnet.
# produce a "grid" of glmnet learners with lambda set to
# exp(-1 to 1 in steps of .1)
hyperparameterized_learners <- lapply(
  exp(seq(-1, 1, by = .1)),
  function(lambda) {
    # create a new learner with given lambda
    new_learner <- function(data, formula, ...) {
      lnr_glmnet(data, formula, lambda = lambda, ...)
    }

    # declare it to be a continuous outcome learner
    attr(new_learner, "sl_lnr_type") <- "continuous"

    return(new_learner)
  }
)

# give them names because nadir::super_learner requires that the
# learners argument be named.
names(hyperparameterized_learners) <- paste0("glmnet", 1:length(hyperparameterized_learners))

# fit the super_learner with 20 glmnets with different lambdas
sl_model_glmnet <- nadir::super_learner(
  data = mtcars,
  learners = hyperparameterized_learners,
  formula = mpg ~ .
)

compare_learners(sl_model_glmnet)
## Inferring the loss metric for learner comparison based on the outcome type:

## outcome_type=continuous -> using mean squared error

## # A tibble: 1 × 21
##   glmnet1 glmnet2 glmnet3 glmnet4 glmnet5 glmnet6 glmnet7 glmnet8 glmnet9
##     <dbl>   <dbl>   <dbl>   <dbl>   <dbl>   <dbl>   <dbl>   <dbl>   <dbl>
## 1    8.05    7.91    7.81    7.72    7.65    7.56    7.55    7.61    7.67
## # ℹ 12 more variables: glmnet10 <dbl>, glmnet11 <dbl>, glmnet12 <dbl>,
## #   glmnet13 <dbl>, glmnet14 <dbl>, glmnet15 <dbl>, glmnet16 <dbl>,
## #   glmnet17 <dbl>, glmnet18 <dbl>, glmnet19 <dbl>, glmnet20 <dbl>,
## #   glmnet21 <dbl>
R is a functional programming language, which allows for functions to
build and return functions just like any other return object.
We refer to functions that create and return another function as a function factory. For an extended reference, see the Advanced R book.
Function factories are so useful in {nadir} because, at their essence,
a candidate learner needs to be able to 1) accept training data, and 2)
produce a prediction function that can make predictions on heldout
validation data. So a typical learner in {nadir} looks like:
lnr_lm <- function(data, formula, ...) {
  model <- stats::lm(formula = formula, data = data, ...)

  predict_from_trained_lm <- function(newdata) {
    predict(model, newdata = newdata, type = 'response')
  }
  return(predict_from_trained_lm)
}
Moreover, given how code-lightweight it is to write a simple learner, this makes it relatively easy for users to write new learners that meet their exact needs.
If you want to implement your own learners, you just need to follow the following pseudocode approach:
lnr_custom <- function(data, formula, ...) {
  model <- # train your model using data, formula, ...

  predict_from_model <- function(newdata) {
    return(...) # return predictions from the trained model
    # (predictions should be a vector of predictions, one for each row of newdata)
  }
  return(predict_from_model)
}
For more details, read the Currying, Closures, and Function Factories article
super_learner() do?There is built-in support for
super_learner() in
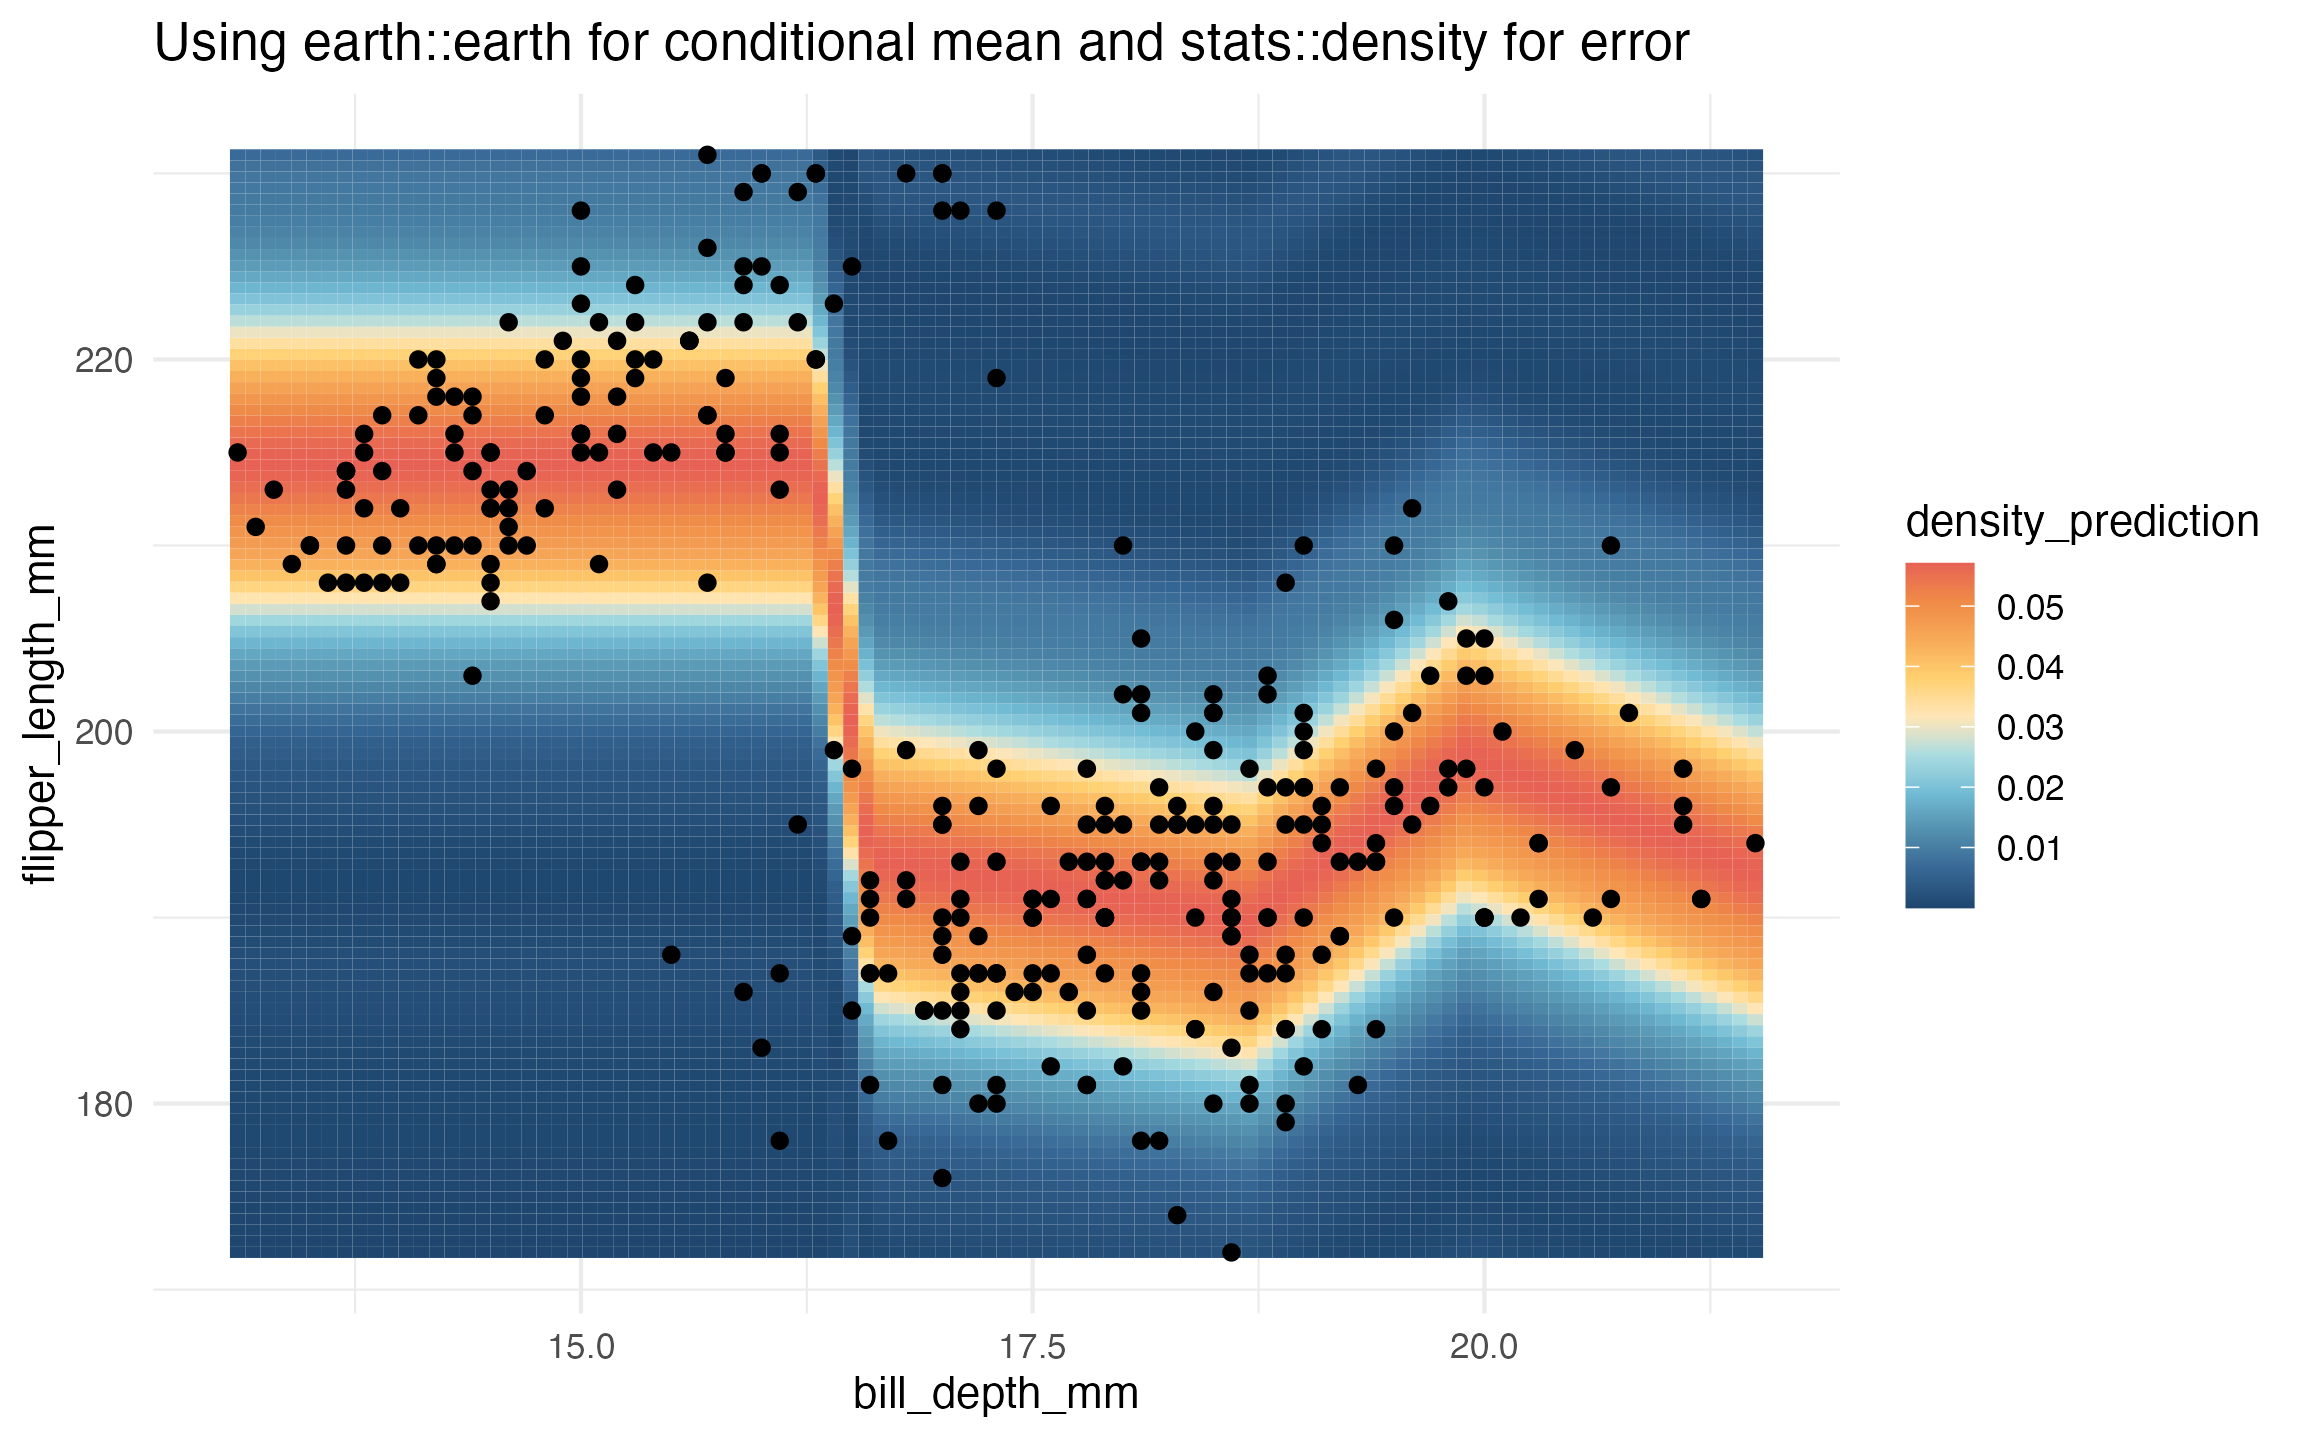
parallelAs a teaser, here’s an example visualization of a density learner
trained on the penguins data:
We also have ≥750 tests (and counting!) that are run at every update to ensure the correctness of the implementation.

View the source code for the tests that are part of {nadir}:
Check out the complete documentation on the package website:
[^1]: van der Laan, M. J., Polley, E. C., & Hubbard, A. E. (2007). Super Learner. In Statistical Applications in Genetics and Molecular Biology (Vol. 6, Issue 1). Walter de Gruyter GmbH. https://doi.org/10.2202/1544-6115.1309
[^2]: Guide to {SuperLearner}:
https://cran.r-project.org/package=SuperLearner
[^3]: van der Laan, Mark J. and Dudoit, Sandrine, “Unified Cross-Validation Methodology For Selection Among Estimators and a General Cross-Validated Adaptive Epsilon-Net Estimator: Finite Sample Oracle Inequalities and Examples” (November 2003). U.C. Berkeley Division of Biostatistics Working Paper Series. Working Paper 130. https://biostats.bepress.com/ucbbiostat/paper130/
[^4]: Zheng, W., & van der Laan, M. J. (2011). Cross-Validated Targeted Minimum-Loss-Based Estimation. In Springer Series in Statistics (pp. 459–474). Springer New York. https://doi.org/10.1007/978-1-4419-9782-1_27